UK-USA visit and SSI/EPSRC presentation

We have carried out initial collaborations between the Manchester and STFC researchers within CCPi in the UK; with Kitware Inc in the USA. My presentation, on early part of this software collaboration, between UK- USA with poster and presentation, is on zenodo.

p20180424_125904_5pw

In our funded work both sides met and are considering research software for 3D volume reconstruction and quantitative visualisation; with a similar (possibly in the future interchangeable) python based pipelines.

webukusa1w

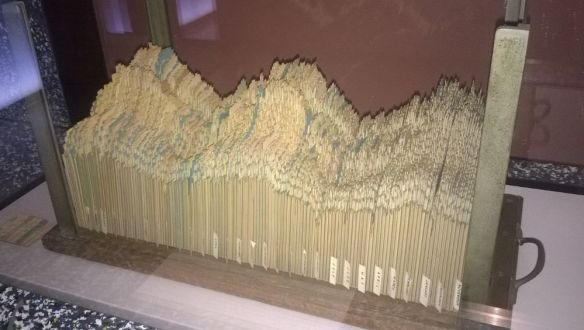
There were two workshop in the last month on what I would refer to as discovering ‘quality’ software through collaboration: an EPSRC SSI meeting at MOSI (Museum of Science and Industry; 24 April 2018 – image above) and then a round table discussion with the CoSeC developers at STFC (Scientific Technology and Facilities Council; 30 April to 1 May 2018).

These meetings will report back on these factors that the development communities think are important; which for ‘quality’ software is not necessarily the same as the needs of the science or the funders. A few comments and question arose that we will think about in terms of future software collaboration activities.


“Be Intuitive and Be Brave”, C. Goble requested of the funding bodies – but this can be useful campaign call across the divide. There is a divide between the science vs the talent that created the tools.

  • How to value this software creation activity – when it possibly involves not just multiple organisations but multiple countries – where the sponsors/funders are only based in one part and may only think in one way.
  • Credits for software should be more like movie credits – so a career path rising up the specialisms until full recognition as a ‘director’ – then possibly we can have the Oscars for research software development.
    • In some sense this indicates how the process often involving a large cast of stars and support staff.
  • Long term life-cycle and sustainability is to be considered; with the issue that good software is 20+ years to implement and maintain: should quality equate to longevity.
  • A common aim is to make code – and the theory of code – that is useful or essential! then the term quality code can easily be applied.
  • If you have quality code, or not, when to do a major rewrite of the sw and how then can its status be maintained (or improved).
  • Essential is a testing strategy: a national Jenkins service is still being maintained with identity management carried out through Anvil (shib access)

To Github or To Not Github

An aside on code repository as this was an ongoing discussion since the EPSRC announced that the repository ccpforge is closing down. Alternatives need to be found. There are lots of options and in the UK we are likely not to have a cohesive national service for a period, but we need a code repository. A key choice for individual projects is to either build and use a local service – say one based at the university of Manchester or one based in SCD at STFC; where you have to have a person responsible for maintenance and identity management etc – or to use an international service say from gitlab or bitbucket and then if you wish to pay for this and to what level. So taking notes of comments:

  1. Paying for gitlab or bitbucket – annual fee, or monthly usage fee – say a few hundred pounds; is a popular option and is minimal in cost as long as there is a small number of developers and only a few private projects requested.
  2. Using mirror site etc is also popular but that does not use all the facilities and just keeps location – this is important possibly for branding issues and helping code to be found.
  3. Issues of branding and identity – means that a local service can have very tight control of branding but at a cost of having to renew and update software.  International services may removing or change rights, permissions for local branding (and worse – advertisement etc) so diluting identity and searchability of the code.

Ongoing debate and reports should be made in the near future to guide the UK community; and we have ongoing opportunities to increase UK-USA and UK-EU collaborations – grants to be written.

MT

Advertisement

Celebrations at Royal Geographical Society – as awarded SSI links to EPSRC UK-USA collaboration

Over 2017 the CCPi (http://www.ccpi.ac.uk/) had an active round of networking and outreach meetings for X-ray CT, culminating with a recognition dinner held at the Royal Geographical Society.

ukusa1

In the start of 2017 we provided a Letter of Support for a DOE project proposed by Kitware inc., as well as submitted our own CCP Flagship proposal. Both were awarded, creating an extra 6 FTE RSE in the UK and 5.1 FTE RSE (Research Software Engineers) in the USA until 2020.
Following this success we were left with a concern that there were no face-to-face networking funds, but alternative electronic systems were being considered until serendipity! – the EPSRC launched a grant with the support of the SSI (Software Sustainability Institute), to ask for travel and subsistence to foster collaborations between research software engineers on both sides of the pond. We applied and had a two week face-to-face collaboration with one of the main Kitware Inc. lead developers, Dr Marcus Hanwell. The topics focussed on their new Tomviz software product (https://www.tomviz.org/): a purpose built open source application that can manage – the data collection; noise filtering, reconstruction, visualisation and final analysis of tomography data.

ukusa3
Talks, facility tours (university labs, ISIS (IMAT) and Diamond (i13) beamlines) and software installation sessions occurred, at RAL (Atlas Visualisation Facility), DL (Hartree Centre visualisation suite) and the University of Manchester (HMXIF) and were enabled by the current extensive CCPi network.

ukusa2

The CCPi now has a presence at three major annual imaging events in the country; each having 50+ attendees. These include an X-Ray user group symposium (ToScA) managed by the National History Museum (NHM) and Royal Microscopical Society (RMS), a technical forum supported by RCaH and DLS; and a “dimensional XCT” conference supported by NPL that is leading to formal BSI/ISO standards.

ukusa4

In 2018, for this UK-USA collaboration, we are looking at new user guides to be created, an open day for software show-and-tell event at RAL and further direct collaboration between the newly recruited software developers to share code and best practice; as well as links to other CCPs involving tomography type data. A follow on impact showcase event will be organised under the EPSRC RSE & ARCHER umbrella on Tuesday 24 April 2018.

TB Visualisation

In the UK there are some medium sized HPC systems being installed, funded by the Research Councils. The tier 2 HPC launch event on 30 March 2017 – and made announcements by the EPSRC CEO Philip Nelson and from Susan Morell (Birmingham)
Peter Vincent (Imperial) presented the PyFR higher-order polynomial CFD that works on all architectures -giving 13.7 petaflops on the USA Titan system. He described VTKm for remote visualisation that rendered the 1TB per-frame data in-situ -vis:
… this claimed and showed you could stream video sets from the 1TB data file stored in the HPC memory in this virtual wind-tunnel type simulation, without saving the data first (or importantly moving it anywhere). it used a type of Catalyst within kitware’s range of tools so could produce paraview type effects.
The results are very impressive, and similar systems are being used in other remote projects. It does require:
  • knowledge of what you wish to view before you compute
  • unable – or difficult – to change the visualisation results (sub-parameters)
  • unknown question as to if you should (or can) store the intermediate data – would take many minutes or longer to do this.
  • cost of visualisation is include – or added to – the cost of HPC so needs accounting for.


Materials Science Regius Professor Celebration

My kind of desk – pre-work within Research IT office, for a touchtable and projection display stand at the University of Manchester Regius Professorship award celebration.

Using the new Acer Predator (17 G9-792) laptop, with an inbuilt great graphics card (NVIDIA® GeForce® GTX 970M with 6GB GDDR5 Dedicated Memory), and touchscreen – bits borrowed from UoM and STFC visualisation groups along with (STFC www.CCPi.ac.uk) tomography data and the drishti-prayog volume visualisation software all appear to run extremely sweet.WP_20170411_001_c
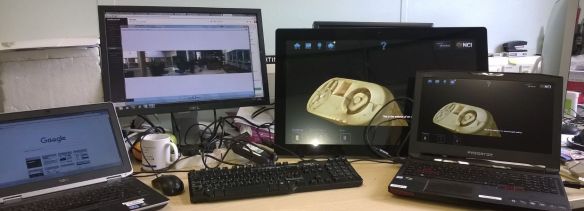
Moving this to the exhibition area within the NGI (National Graphine Institute) with a HDMI splitter should then be suitable for 100’s of viewers per hour …

Show setup for 150+ special visitors. This example on the screen (one of about 15), just prepared, showed work from by the new EPSRC Flagship CCPi fellowship, Daniil Kazantsev et al from RAL that using multiple volume vis transfer functions highlighted the centre and the fractal edge of slices showing dendritic behaviour (even measurable).

IMG_0262_cw

The laptop and small workstation were hidden and all you see is the touchtable, controlled by the operator or user on the right, and the main screen allowing multiple people to view and comment at once.

The volume visualisation was a little tricky as the raw data had been pre-segmented already so I had to create a boundary edge by interpolation and reducing the size of the complete object.

There was a talk by Regius Phil Withers after a presentation of the award from the Queen’s representative, as well as a question and answer session chaired by the President of the University of Manchester.

Old fashioned video streams

Not really vis but this was important in the day.

Back in the Computer Lab., at the University of Cambridge in about 1992 there were at least two filter coffee systems; both running on a slow drip-filter setup. The Rainbow Group had access to one machine in a walk down a corridor to a small kitchenette; but the network team had to travel a lot longer way to their coffee machine. A problem of lack of enthusiasm to travel meant that often they would find an empty coffee pot – or even worse stale coffee. A solution was a camera video stream that linked to the linux server and stream images to X Windows. So when new fresh coffee arrived this would be obvious from the image on everyone’s desktop.

http://64bits.co.uk/ have been rebuilding old systems and in East London they rebuild the Cambridge Coffee pot scenario – with similar equipment. There is a wikipedia page on the original: https://en.wikipedia.org/wiki/Talk%3ATrojan_Room_coffee_pot

WP_20170415_006_c

Is video streaming – visualisation – well definitely yes as it is an interpretation. Due to low quality network speed and CPUs; the small 128×128 video stream of images had to just include the coffee level and also the fps was about one frame every few seconds – but that is a good rate and good enough resolution for “coffee pot observation”.

Touching …. vol vis …

Touchscreens are all the fashion – but  any system you deploy is expected to work smoothly and intuitively – including visualisation ones. There are some company purpose-built systems for exhibitions that are far from cheap although they may work well they can also suffer from lack of agility when recreate new content. There are also simple tablet/phone software options available for touching and manipulating volumes but can have limited graphics ability.

Over the last couple of years we have collaborated informally with partners to share knowledge on open source solutions for large scale volume visualisation (say greater than 256 x 256 x 256) on a touchscreen device.

A hardware specification service has evolved where we can assist with advice and quotes for touchscreen and workstation visualisation nodes, as well as more importantly related software installation; used for exhibitions and PE. A wiki is available at:

http://tyne.dl.ac.uk/twiki/bin/view/Visualisation/ProjectsTouchTable

At Manchester, connecting through Research IT, there are now groups available to informally share equipment and expertise – and as importantly share experience in interacting with the public and other scientists – even if their research data content is often diversely different.

  • MRI medical data e.g. exploring white-matter changes within the human brain: Geoff J M Parker, Hamied Haroom, Saray Parkes (ISBE)
  • Multiple Materials Science analysis e.g. cracks, fibres and mechanical defects: Sarah-Jane Clelland, Phil Withers (MXIF)
  • Fossil and everything ancient within the Manchester Museum: Russell Garwood, Alan Brown, Campbell Price, Roy Wogelius (ICAL)

Both being asked to be available for the upcoming Presidents Office organised ‘University Celebrations of Regius Professorship’ on 25 April 2017 in the NGI.


Vis in the 50’s

I was having to wait for a train at Euston Station in London- and visited the Welcome Trust that is opposite, and they had an exhibition on the story of electricity.

One neat bit of 3D visualisation was near the end of the exhibition and showed a 1950s Electrical Consumption Graph:

WP_20170308_004_c

“This 3D graph, compiled by the planners of the Central Electricity Generating Board, represents the daily electrical energy consumed over a period of two years during the 1950s.”

Unfortunately, not very interactive – with the glass protection, although you can view it easily from many angles; but a few things were right in that they chose two years of data. This is a trick used today even when there is only one year’s data available – where you recommend copying the data – and was used by Florence Nightingale in her more radical circular statistical plots (of morbidity rates during the Crimean war). The problem comes with matching the ends up – between January with December in most calendar statistics. These should be continuous, but the human eye has difficulty in spotting smoothness etc. If you can not use circular plots and in this case with card indexes this would have been very difficult, then by repeating the data or here using two years of data, you can see the changes between December and January as clearly as  any other pair of neighbouring months.