Immersive Manchester’s first face-to-face event occurred, on the 1 December, at the Bonded Warehouse (former location of Coronation Street) where numerous creative companies have installed themselves including a base for AVimmerse. About 60plus attended the evening session hosted by Keith who has also lectured at the University of Manchester.
The discussion flowed on the tech to the applications to the repeat historical notes from previous decades – with references back even to the early 80’s (sure could have been earlier ones). Speakers included:
-Keith Myers: ‘What is the metaverse and should I care? Where the technology will likely head.’ contact@AVimmerse.co.uk -Simon Benson: ‘The Path to the Metaverse for all…foundational technologies and trends that are likely to significantly amplify the influence of the Metaverse.’ Simon.Benson@TalentForTech.co.uk -Mark Ashmore: ‘A brief history of the journey to the metaverse. As Web 3.0 , Web3 and the Metaverse become trending buzz words, what is actually happening?’ Immersive Arts Laboratory – By Future Artists -Peter Woodbridge: ‘Beyond the metaverse. Immersive, Realtime & Spatial Technologies…TV and Film to creating new opportunities’ woodbridgepj@gmail.com
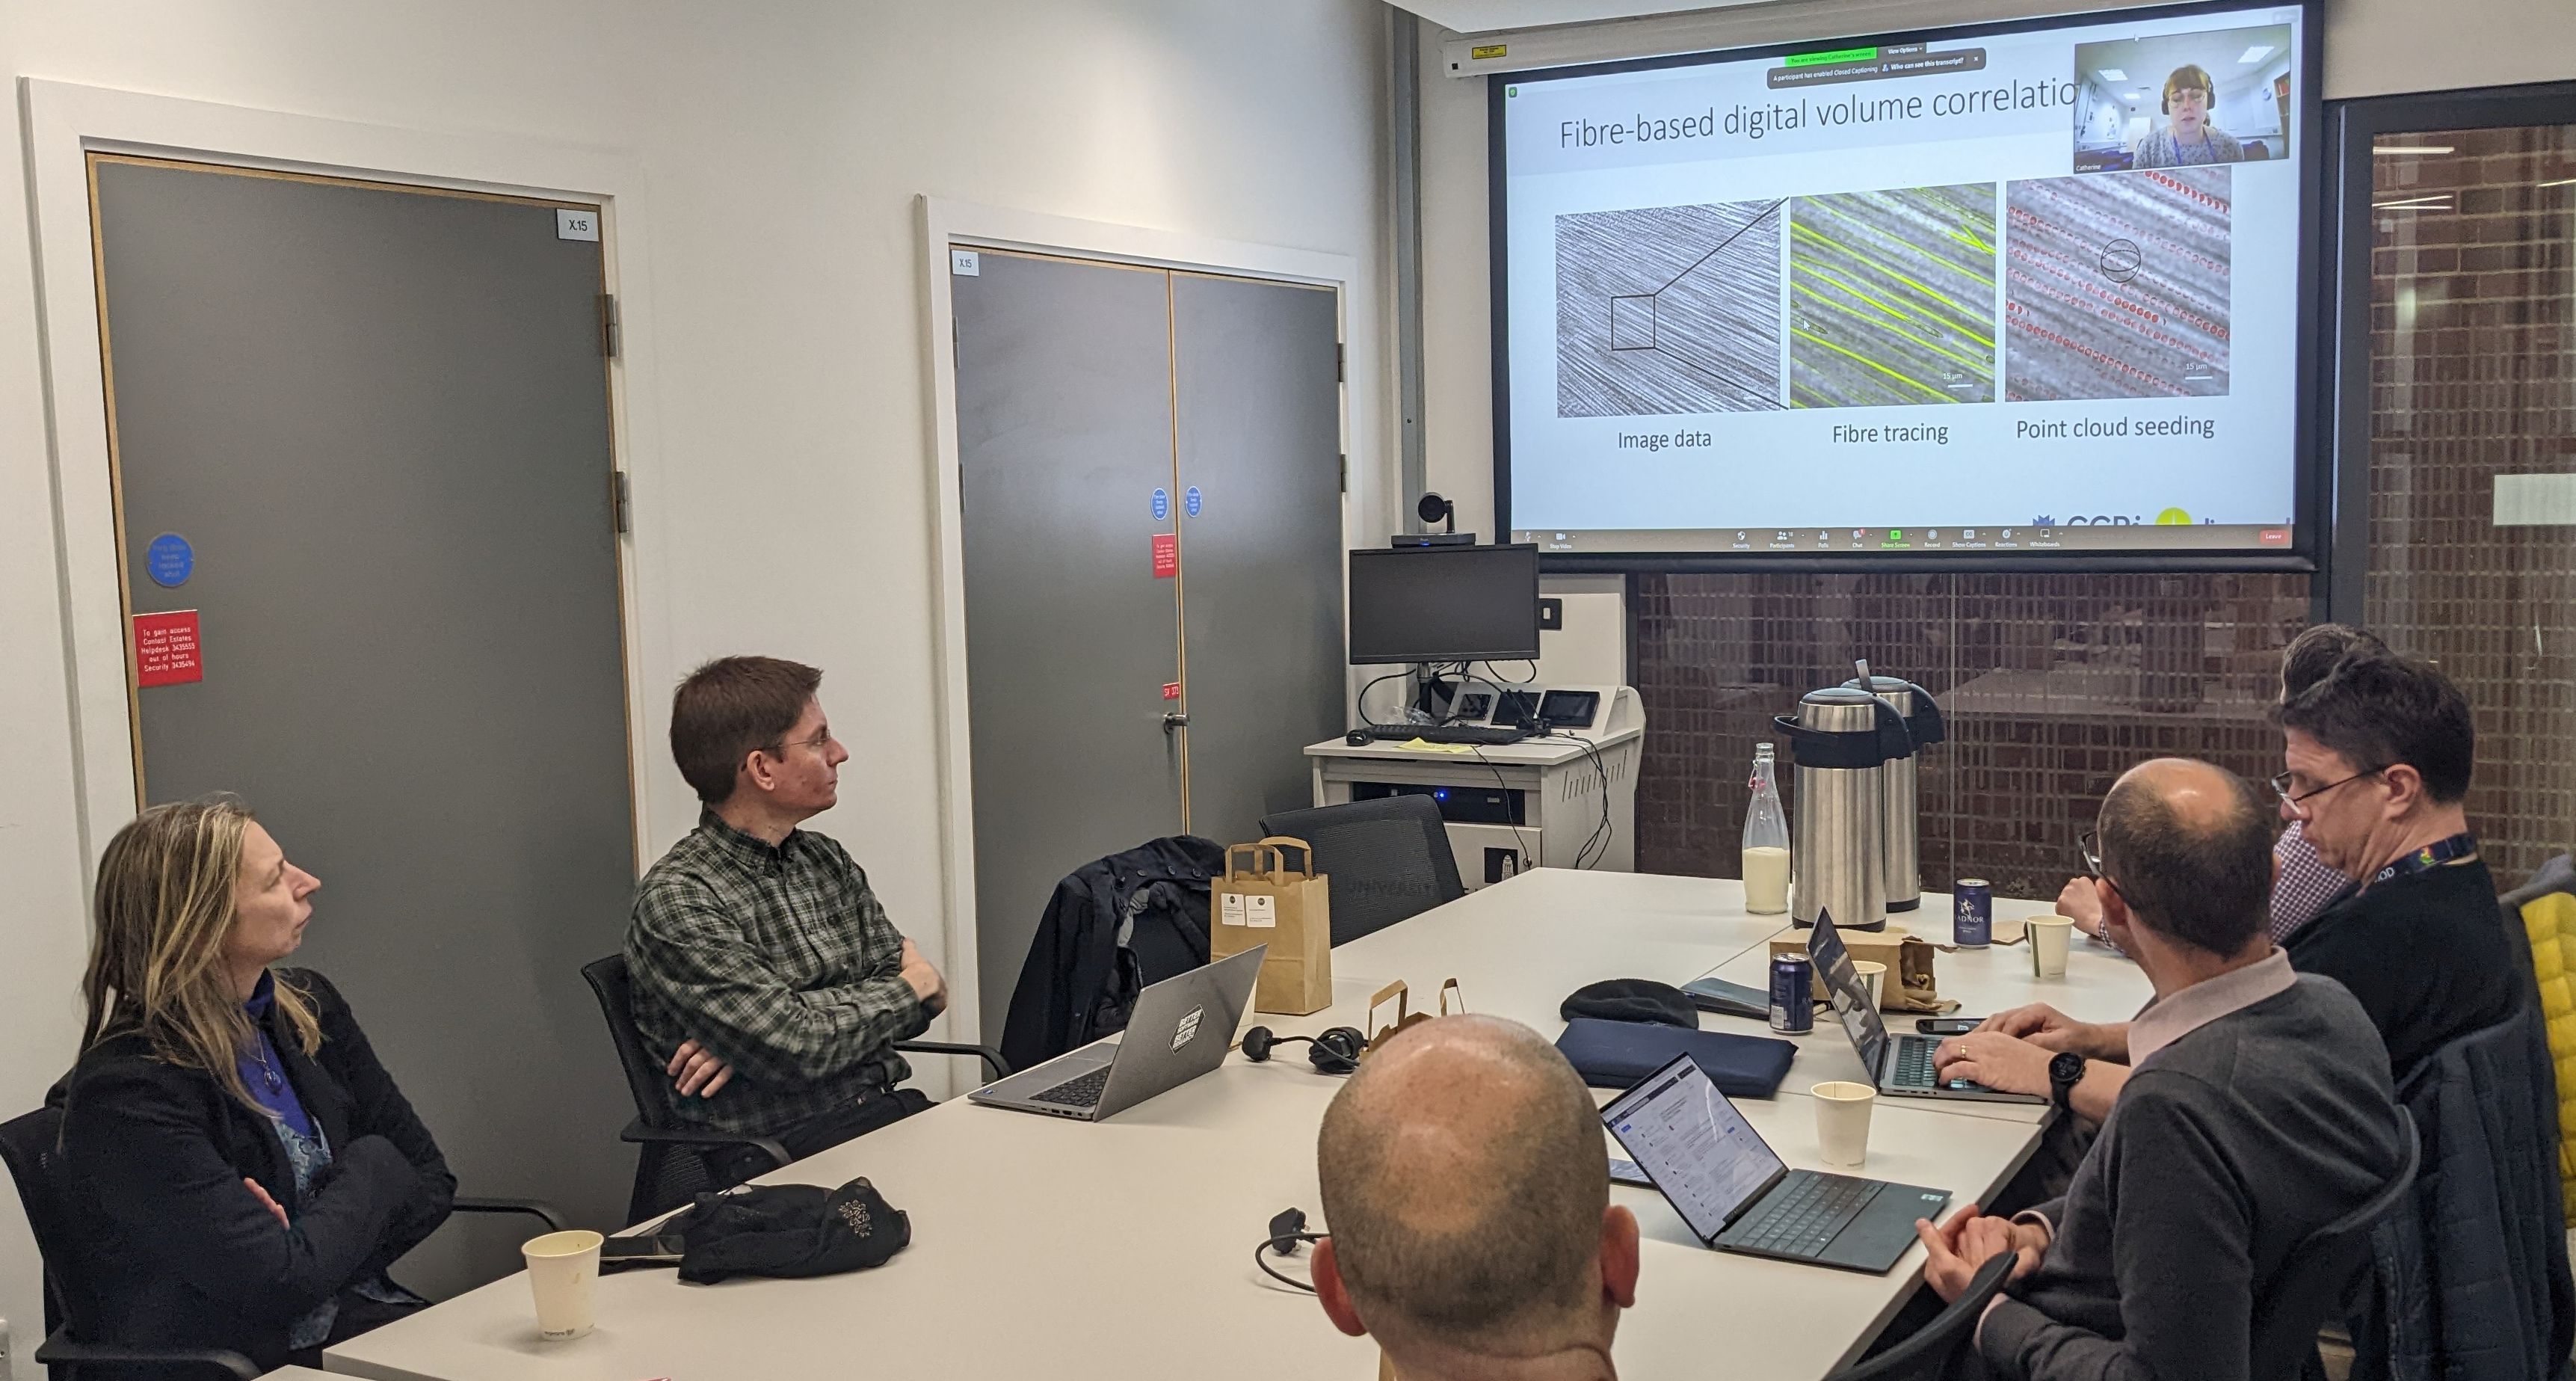
Catherine Disney gave a presentation talk at the CCP Steering Panel meeting that was hybrid from the University of Leeds (in the newly opened Bragg Building; 23 November 2022) – across all the sites, after winning the CoSeC Impact award 2022.
She was a joint winner for the 2022 Computational Science Centre for Research Communities (CoSeC) Impact Award utilising effort from the https://www.CCPi.ac.uk development team and these specific results focused on quantifying intervertebral disc microstructural dynamics of collagen fibers using digital volume correlation (DVC).
The CoSeC Impact Award application for 2023 will be ready in January – and link here when available. Contact the Core CCPi (CIL) development team to gain hints and guidance on submitting an application.
Training course continue and a specific DVC is on 6 December 2022.
Identifying differences between very similar images
Background
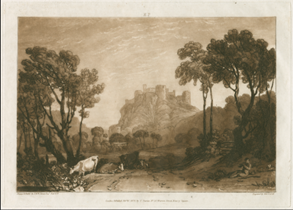
Identifying changes between two successive images is a necessary pre-condition of following change, and its significance. JMW Turner 1775-1851 (voted Britain’s most popular artist) produced upwards of 900 prints in his lifetime. One of the reasons for his reputation was his obsessive attention to refining the details of his prints. As a result, he and his engravers produced a succession of working proofs (states) for each print before it was published and a succession of different (usually deteriorating) versions for sale. Identifying these changes has, and is, traditionally done by placing two impressions of the print side by side, then looking for differences line by (microscopic) line. But that is really difficult to arrange when the pieces of paper are scattered across the world in institutional and private collections. Using the rapidly improving digital image analysis can provide a method of automatic comparison.
There are a number of difficulties. The process of making an impression from a metal plate involves humidifying the paper to ease the transfer of ink, then drying the impression, resulting in differential swelling and shrinkage which is different between different printings, papers and subsequent environmental conditions. Since their printing, many impressions have undergone mechanical damage, staining, or modification such as colouring. This makes comparisons somewhat more difficult. A trained human eye can learn to discount these distortions to follow individual features.
A first try at this problem by Anja le Blanc, see https://studiorum.itservices.manchester.ac.uk/print-comparisons/, used the strategy of aligning the two images using significant features on the images, such as a frame line and omitting the colour changes in the paper. Then cutting the images into 20 pixel squares and realigning using an average of the visible feature. Then identifying the lines/features in common. Then identifying and displaying the lines present/absent in one or the other image. This process was repeated in successive squares to cover the entire image. This was an excellent proof of concept, but threw up a number of problems. The major one is the difficulty of achieving good, i.e. perfect, alignment of the original printed lines in each square. The second one is ensuring that there is no mis-alignment between adjacent squares, which results from the initial alignment, and necessary distortion to align, of the initial images.
Deliverables
There are a number of requirements which require interim deliverables. The following is one suggested strategy, but the student may well come up with a better one.
Identifying the features common to both images then placing them on a standardised grid. These features probably include every common printed line and point. In general, there are about 6 different “states” known for each print during development. So this standardised grid should be reusable, and refinable, for future comparisons.
Normalising the images so that all the printed features have the same (or comparable) contrast with the background paper. Both the colour of the paper and the intensity of the ink colour can vary considerably, because of variability in the materials used initially and subsequent ageing, wear and tear. Again for a more general solution, it would be useful for all prints to be normalised to the same standard.
Overlaying the images on the standardised grid and ensuring the maximum coincidence of features.
Carrying out subtractions to show the features uniquely present and not present in each comparator image.
Reference Example Manipulaitons
High resolution images are available for all these. It would be useful to re-work the examples shown on the Turner webpages for comparison, These two impressions are nominally the same state, but look very different. Are they?
Reference Example Manipulations
High resolution images are available for all these. It would be useful to re-work the examples shown on the Turner webpages for comparison,
These two impressions are nominally the same state, but look very different. Are they?
1a. F008_iv_ad_ad0010_PM
1b. F008_iv_cvh_cvh3339_PM
This is a successive sequence of images: 2a. R401_etc_cvh_cvh0140_PM
Stitching photographic images – eliminating errors in stitching.
Background
Stitching a series of image tiles captured in a mosaic into a coherent image is a frequent requirement in photogrammetry, mapping, etc. Current software packages appear to use a common methodology of bottom up matching patterns, by simplifying the image on each tile, merging these images, then filling in the details from the original tiles. However and increasingly, the tile images are captured across a tightly controlled imaging network, so the positional relationship between the edges, or overlaps, of the tiles are available. The standard method of stitching largely ignores both these interfaces and the internal structure of each tile. As a result, confusing tiles result in misaligned and distorted mosaics (fig.1) which are not tested and corrected against the detail in the original tiles. Researchers currently have considerable difficulty in finding a methodology that will reliably stitch such data sets.
In many fields (Google Maps is the most obvious application), high resolution images are readily obtained for small areas of the object of interest. For use, these tiles must be stitched to create a wider field image at the same resolution and without loss or distortion of the detail captured. This current project is part of the creation of an online catalogue of JMW Turner’s C19th prints. The engravers of the time achieved a resolution of line and image that could exceed the resolution of the paper substrate, and has been rarely matched since. One aim of the project is to provide digital images of each print that match the resolution of the original, which can vary from ca 1200 to ca 3000 dpi. The prints vary in size from 5×5 to 700×800 cm.
Description
The researchers want a reliable method that does not require many iterations of settings to optimise (but rarely do) the stitching of each image. There are two basic approaches depending on the type of source data being used. The creation of panoramas from a fixed camera position requires considerable adjustment, i.e. distortion, to align tiles in the perspective geometry. This approach has informed and underpinned many available stitching programs. Examples are PTGui fig. 2 (https://ptgui.com/), Agisoft fig.3 (https://www.agisoft.com/).
However, the scientific community usually starts with a set of images taken from a mesh of camera positions, each with a more or less orthogonal geometry, which might be a microscope slide (https://pages.nist.gov/MIST/ and https://abria.github.io/TeraStitcher/) or the Milky Way (http://montage.ipac.caltech.edu/). It is proposed that this additional location data is incorporated into the stitching algorithm in order to reduce the tendency of image matching to create false matches.
Because there is usually a considerable overlap between adjacent tiles, there are few places in the overall image that do not contain the true local image.
The preparation of the mosaic needs to have a correction stage where the constructed interfaces can be compared with, and corrected by, the known true image.
Deliverables
A software package to create mosaics from well characterised sets of tiles, with minimal misalignments and distortions. The required input parameters and data structure should be explicit and readily provided by the person preparing the set of tiles.
A number to training sets can be provided, captured in various ways.
Image Results References:
Fig 1. A cascade of misalignments of horizontal lines, seen on the left and on the far right. This image was prepared with Microsoft Image Composite Editor from a set of 8 scans of a Turner print, each 1.9 GB, R652_i_cvh_cvh3092_PM_stitch.tif. ICE is one of the more reliable stitching programs.
Fig. 2 A more obvious misalignment, similarly the result of MCI, R207_i_cvh3337__stitch.psb
Fig. 3 A typical misplacement of tiles by PTGui, R699_PTGui_frame_stitch.jpg.
Fig.4 A mosaic prepared from a set of tiles using Agisoft. The edges of the rectangular set of tiles were not recognised by the software. R650_etc_cvh0252_AgisoftExportOrthoMosaic
After many decades or dereliction, then rebuilding – and a big promotion period – the Bletchley Park museum is extensive and fully open – this is where 1,000’s of workers cracked the German World War II codes in complete secret with of course the making of Alan Turing.
A new section, next to the core museum, is on data and visualisation . One installation shows density of cities – and although London is to some people ‘packed’ thanks to large amounts of open spaces, due to its unusual history, has a lower density than many similar mega-cities. London (far model) vs Hong Kong (near model) [pic from BP].
Objects in 3D sometimes (actually always) move while you scan and then rescan them, which although sounds like a disadvantage can be an advantage. Then you can detect sub-3D areas within the volume that distort extracting their direction and magnitude which you can derive to evaluate extraction values for stress, growth or decay (compression).
To extract these shifts in 3D space a process called Digital Volume Correlation which is employed that is computationally intensive. The team at the CCPi (https://www.ccpi.ac.uk/) have developed new interface code and also a logo – relevant as we are considering new logos for the CCPi Core Imaging Library (CIL).
Within our Tomographic Imaging network ccpi.ac.uk we gave a talk Introducing the CCPi Core Imaging Library – Dr Edoardo Pasca (25 January 2022 11am), STFC’s Scientific Computing Department.
Abstract: The Collaborative Computational Project in Tomographic Imaging (CCPi) Core Imaging Library (CIL) is a versatile Python package for tomographic imaging intended for CT experimentalists to easily access optimised standard algorithms, create bespoke pipelines to handle novel imaging rigs, dynamic, hyperspectral, non standard scan geometry, to name a few. CIL is also intended for imaging specialists to allow the creation of novel reconstruction algorithms and assess them against established ones. CIL seamlessly handles the CT pipeline from loading data from common lab X-Ray CT machines, as NIKON or ZEISS, to FDK or iterative reconstruction. CIL also provides utilities for visualisation and exploration of the data. In this seminar, Dr Edoardo Pasca will talk about some examples of applications of the methods available with CIL.
This included a live demonstration – see below – where Edo created a reconstruction of a walnut, X-ray CT scan, where the data (middle image) was severely limited, but modern iterative solutions (right image) achieve almost the same as the gold standard result (left image).
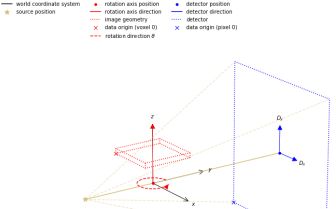
Recording available soon – but one extra almost essential part is an automated visualisation module (also written in python) to describe the lab set up (the geometry of image capture and object space – credit to Gemma Fardell).
So to understand the visualisation of the resulting images; you need to understand the visualisation of the geometry of the laboratory setup.
Timos Kipouros – engineering vis for optimisation: use of ||coord for blade design and then understanding – has taken about ten years to convince managers of the practicalities.
‘… you are going to need a bigger screen’
Discussed the human-in-the-loop for Comp Eng Design cycle : and now in the future could add the dynamic data information (e.g. Rolls-Royce monitor engines as they fly)
“use optimisation to solve a problem but also to understand your problem”
So I am a great fan of open source and royalty free access to academic research materials. The creative commons movement, green/open access publishing and the ability not to be charged multiple times to produce and then read material is great. See the Tomography (3D volume) zenodo pages of articles / data / code and links that we are starting up and maintaining for researchers; which is good as this also allows DOI tags for all entries meaning governance and many of the data management processes are met.
But, if you are at a certain age, with academic writing, in the past you will have built up a legacy of material that still has copyright; even if no more of these books or articles are being sold and possibly now the rights to reprint have been returned to the author. So there are no more royalty payments being received and you have no indication of number of purchases.
Linking on these now go to resellers where you can buy a second hand version or even download copies. Many people I have been told are photocopying sections in libraries and gaining material that way which is fine by me, but when asked you can track down this kind of usage.
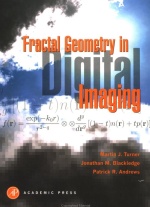
The ALCS was set up (details below) to link photocopy rights and other electronic rights where material is copyright back to the authors. It was an easy process to register all the key books and then wait for the next six month review to take place. The last one arrived and states the vast majority >90% of photocopying is from one book – the Fractal Geometry book – thanks to people in New Zealand for copying sections of the Geographic Visualization.
AUTHORS’ LICENSING AND COLLECTING SOCIETY 1st Floor, Barnard’s Inn, 86 Fetter Lane, London EC4A 1EN +44 (0)20 7264 5716, http://www.alcs.co.uk
Dealing with network software projects, many based on imaging, I have a preferred license model: that favors Apache License version 2.0, which allows virtually all uses for the code, and this can incorporate other licenses say for libraries etc. (options then are through GPL3).
Thanks over many discussion for this policy – note not binding officially in any sense – including contributing as a modified version of the CCP_PETMR / CCP_i / savu_DLS communities.
To contribute code to this project, (“the Software”) this is under the terms of the Apache License version 2.0 (AL2) or under the terms of the GNU General Public License 3.0 (GPL3). The Software provided is described as follows: {add details here}.
Any other software: unless indicated otherwise at the time of provision, such additional software shall be deemed incorporated into the definition of “the Software” under this Agreement and licensed to the owners under the same terms. Such contribution could for instance take the form of a submission of a pull-request or a git commit.
The ownership of the copyright in the Software licensed will remain with us, the contributor, and we request that the names of the authors as copyright owner, are acknowledged on any copy of the Software that you may release in original or modified form.
Furthermore, as stated by the AL2 terms and without intending to affect those terms, the Software is provided without any warranty as to its quality or fitness for any general or particular purpose.
We confirm that the Software was entirely created by the authors named and that the licence granted under this letter will be valid and binding upon us.
Apache license as used within PETMR is here (note links to GPL):