
I was having to wait for a train at Euston Station in London- and visited the Welcome Trust that is opposite, and they had an exhibition on the story of electricity.
One neat bit of 3D visualisation was near the end of the exhibition and showed a 1950s Electrical Consumption Graph:
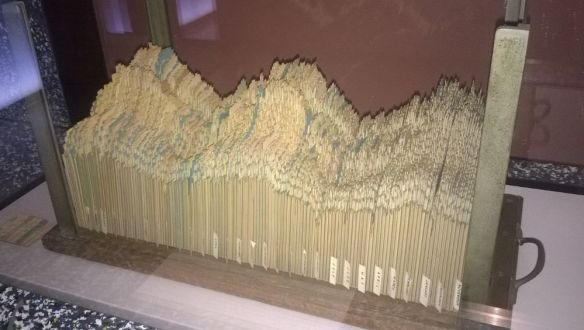
“This 3D graph, compiled by the planners of the Central Electricity Generating Board, represents the daily electrical energy consumed over a period of two years during the 1950s.”
Unfortunately, not very interactive – with the glass protection, although you can view it easily from many angles; but a few things were right in that they chose two years of data. This is a trick used today even when there is only one year’s data available – where you recommend copying the data – and was used by Florence Nightingale in her more radical circular statistical plots (of morbidity rates during the Crimean war). The problem comes with matching the ends up – between January with December in most calendar statistics. These should be continuous, but the human eye has difficulty in spotting smoothness etc. If you can not use circular plots and in this case with card indexes this would have been very difficult, then by repeating the data or here using two years of data, you can see the changes between December and January as clearly as any other pair of neighbouring months.
